Guide Lines: Things Aren’t Always As They Appear…
Graphs are wonderful tools. They are suited for every type of angler and as consumers we can choose how we make our graphs work for us. I’m a practical person; to suit my fishing style I try to derive what I need from a graph or computer and become proficient with a handful of settings to improve efficiency. While I have very nice graphs on my boat, I try to keep my fishing simple by starting with the basic information and settings my graphs provide.
I feel the most important feature of a graph is the depth reading. Yup, that’s it – depth sounding! We need to know how deep we are fishing to be repetitive and accurate. When we see the digital number in the corner of the graph screen, we know for sure how deep it is. What ever else we derive from these machines is bonus. Fish are instinctive animals—so in order to be good anglers we should be instinctive too. Therefore, remember that graph interpretation is key! What you think you see on your graph’s screen and what is actually under your boat may be completely different, be cautious of what you let your graph tell you. Understanding how your graph creates the images it draws is a big first step to becoming a proficient graph user. 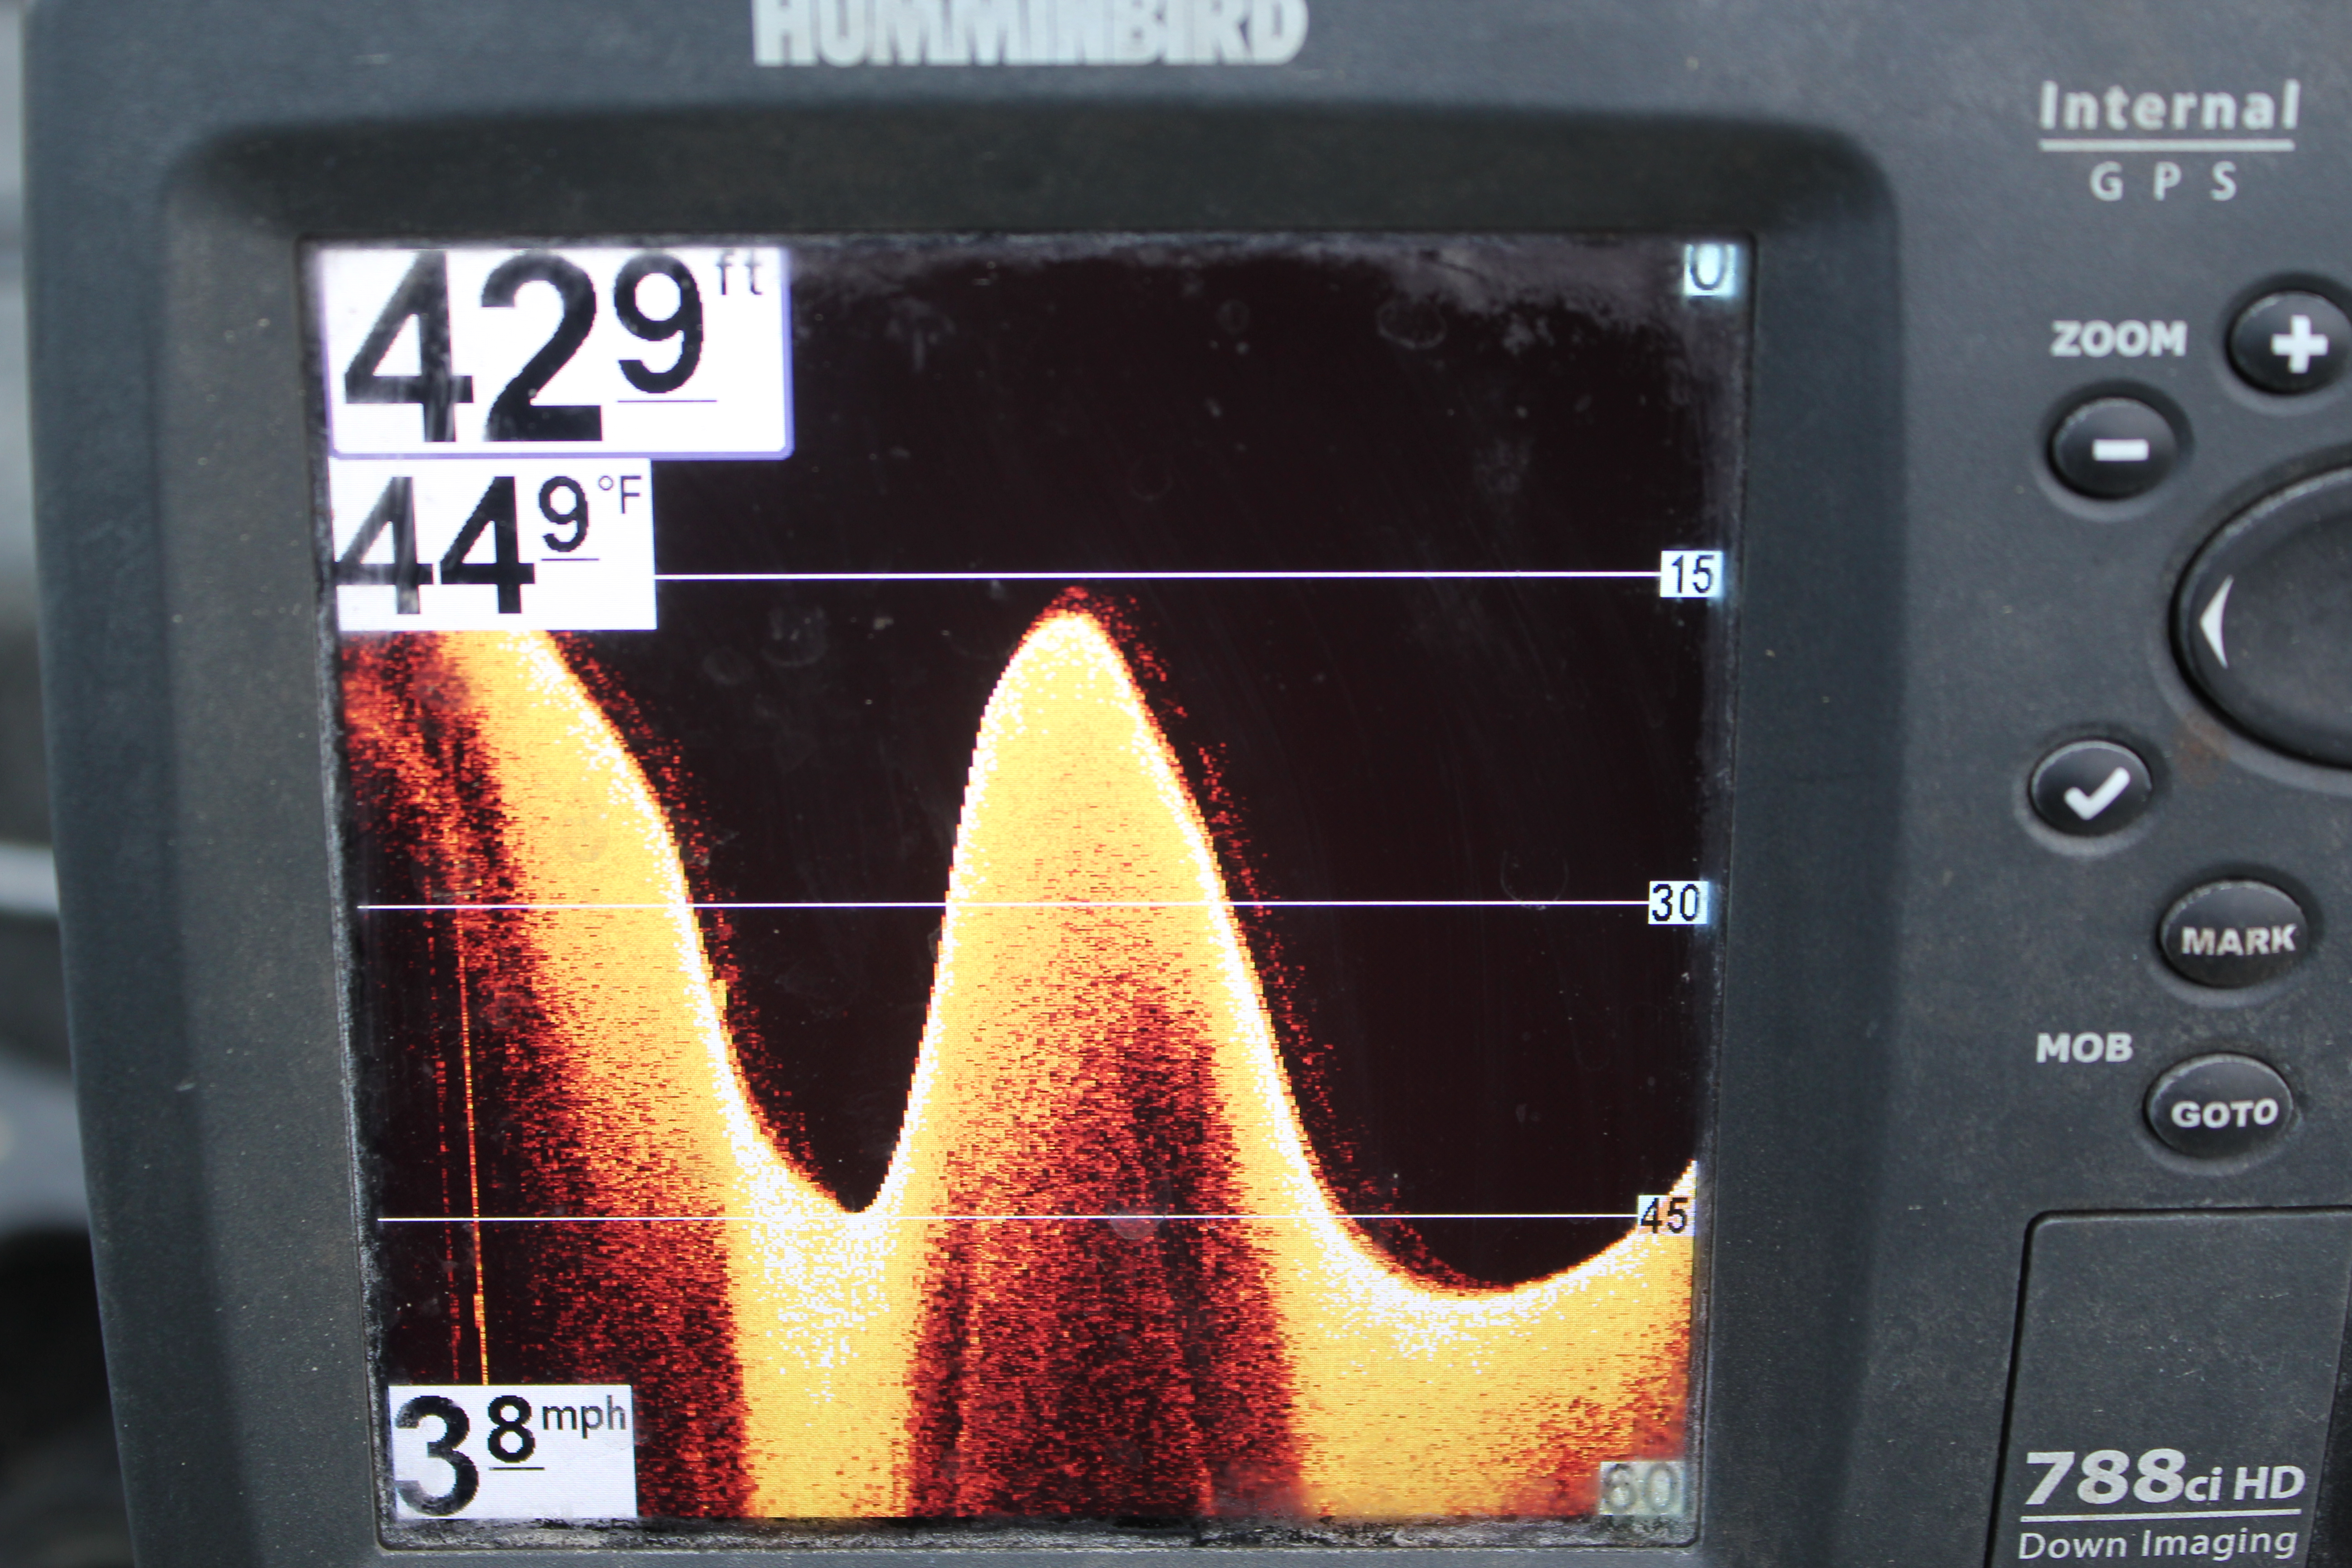
The Humminbird Imaging Scan graph to the right is a great tool. I really like Down Imaging because there is a lot less clutter in its images than regular sonar provides. I also find the overall images to be crisp and the color pallet options for down imaging soothing and easy to see. Most folks looking at the image below see a drop-off and then an island adjacent to the drop. People know that there is an island there because it’s exactly what the graph shows. However, as I said before: interpretation is key! Despite the fact that the graph shows an image of an island – THIS IS NOT AN ISLAND!
I created that picture. I drew it with my boat. Why? For this. This is Graphing Awareness 101. What you need to know and understand about graphs and graphing is that the depth signal crosses the graph screen as a single line. It never stops drawing the single line. The graph does not know if it’s on an island or drop off it just keeps drawing a line of depth. The one dimensional image you see looks impressive and “structured.”
How did I draw it? I boated off of the drop you see to the left of the alleged “island” and then I turned the boat around at a fair speed and drove the boat back up the same drop. When I got to the top of the drop, I drove off the drop again. The graph recorded the depth changes and the depth-lines resulted in a pattern that happened to look like an “island,” when in reality, it was just a simple drop off.
You need to believe your graph. Your graph works exactly as it should. HOWEVER, you need also be aware that the image your graph displays might not be the 3-dimensional structure your brain wants it to be. Here’s another scenario for example: If you drive your boat over a long narrow bar in the middle of a lake (one that’s not mapped out), your graph will display that bar as an island. It’ll look exactly like the image in this article. You might think you found an island, but before you start fishing, you need to investigate and make sure you know where the shallow water really goes. The only way to do that is to turn your boat around and look for yourself. The “island” (which is actually a long narrow bar), might be a mile long or it might extend from one shore on the lake to the other. You need to slow down and research it. Your graph is programmed to help you but you need to interpret the information fairly and subjectively. If you work with your graph, it’ll work with you. Follow this advice and you’ll soon become a great and potent fishing team. Good luck graphing and fishing.
Ross Hagemeister meisterguideservice.com